> ## Documentation Index
> Fetch the complete documentation index at: https://docs.tryhoard.com/llms.txt
> Use this file to discover all available pages before exploring further.
# Sales
> Revenue, orders, pulls, customers, returns, and shipping signals in one workspace.
The **Sales** tab is the operating workspace for orders. It combines financial performance, open order work, customer signals, pull sessions, returns, and shipping mix.
 ## Overview
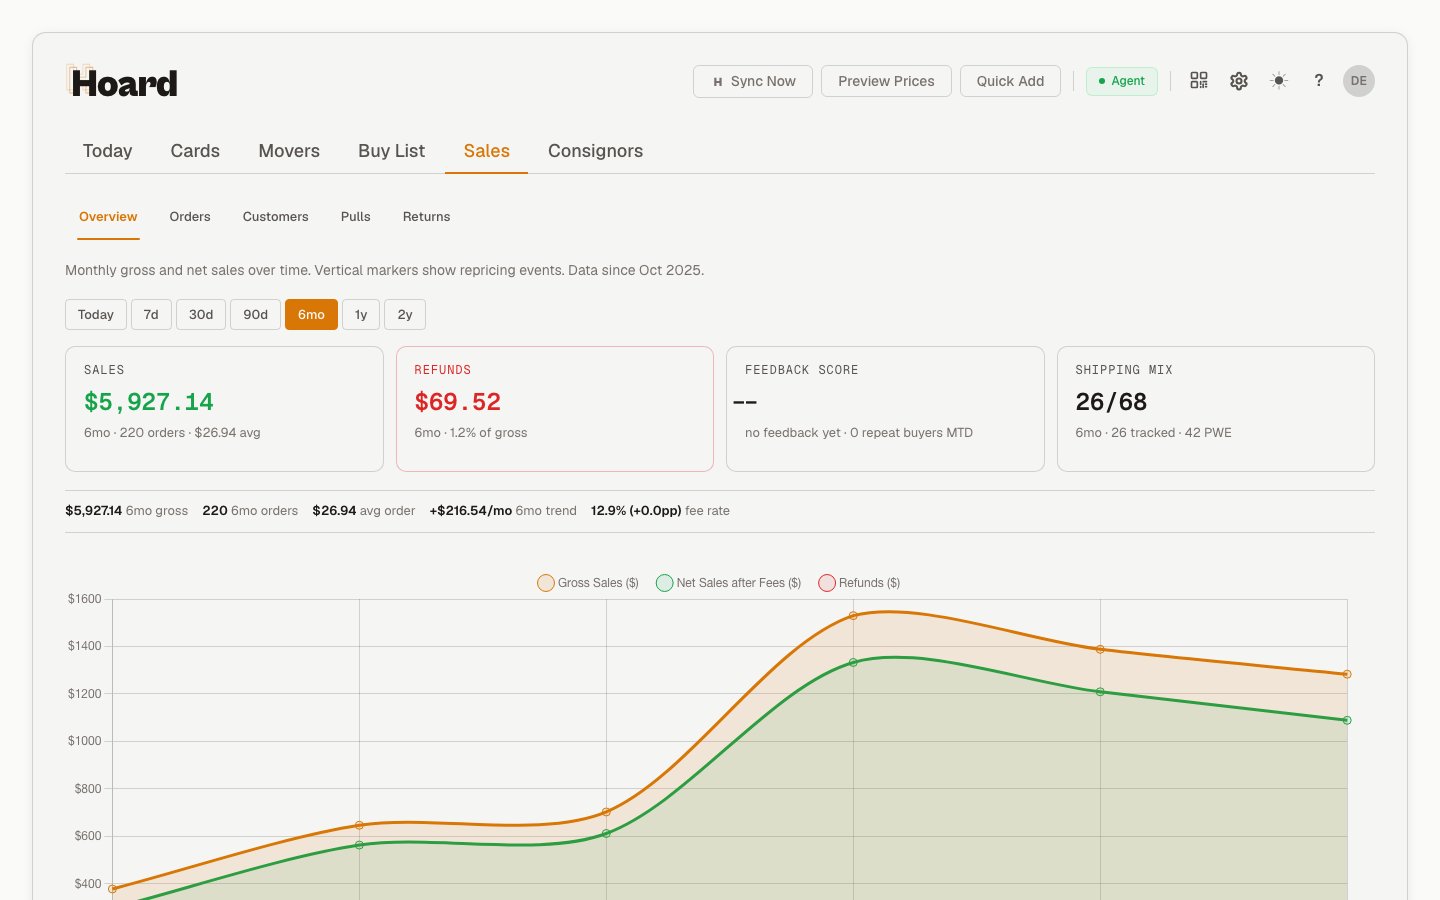
A row of period pills sits above the cards — **Today, 7d, 30d, 90d, 6mo, 1y** (and **2y** on Pro). Picking a window scopes the cards to it; **Today** shows same-day figures.
| Card | What it tells you |
| -------------- | --------------------------------------------------------------------------------------------------------------------------------------------------------------------------- |
| Sales | Gross sales for the selected window, with order count and average order value in the subtext |
| Refunds | Refunded dollars for the window and the refund rate as a share of gross |
| Feedback Score | Your average TCGplayer feedback rating over the last 100 ratings, with repeat buyers this month in the subtext. Turns amber when a sub-5 rating arrives in the last 7 days. |
| Shipping Mix | How many orders in the window shipped tracked versus PWE |
Below the cards, a detail bar carries the longer-range metrics for the window: gross, orders, average order value, trend, and fee rate. The chart and monthly table show gross sales, net sales after fees, refunds, and order history over time.
The count of orders still waiting to be packed shows in the **Sales (N)** tab label and on the Orders subtab; an active pull session's order count lives on the Pulls subtab.
All figures use your account timezone.
## Subtabs
* **Overview** shows the period-scoped sales summary plus the historical sales chart
* **Orders** lists imported TCGplayer orders, with a shipping breakdown and an orders-over-time chart side by side
* **Customers** shows repeat buyers, customer lifetime value, notes, and order history
* **Pulls** starts and manages [Visual Pull](/features/visual-pull) sessions for open orders
* **Returns** shows refund orders, repeat refunders, and a restock pull sheet
## Overview
A row of period pills sits above the cards — **Today, 7d, 30d, 90d, 6mo, 1y** (and **2y** on Pro). Picking a window scopes the cards to it; **Today** shows same-day figures.
| Card | What it tells you |
| -------------- | --------------------------------------------------------------------------------------------------------------------------------------------------------------------------- |
| Sales | Gross sales for the selected window, with order count and average order value in the subtext |
| Refunds | Refunded dollars for the window and the refund rate as a share of gross |
| Feedback Score | Your average TCGplayer feedback rating over the last 100 ratings, with repeat buyers this month in the subtext. Turns amber when a sub-5 rating arrives in the last 7 days. |
| Shipping Mix | How many orders in the window shipped tracked versus PWE |
Below the cards, a detail bar carries the longer-range metrics for the window: gross, orders, average order value, trend, and fee rate. The chart and monthly table show gross sales, net sales after fees, refunds, and order history over time.
The count of orders still waiting to be packed shows in the **Sales (N)** tab label and on the Orders subtab; an active pull session's order count lives on the Pulls subtab.
All figures use your account timezone.
## Subtabs
* **Overview** shows the period-scoped sales summary plus the historical sales chart
* **Orders** lists imported TCGplayer orders, with a shipping breakdown and an orders-over-time chart side by side
* **Customers** shows repeat buyers, customer lifetime value, notes, and order history
* **Pulls** starts and manages [Visual Pull](/features/visual-pull) sessions for open orders
* **Returns** shows refund orders, repeat refunders, and a restock pull sheet
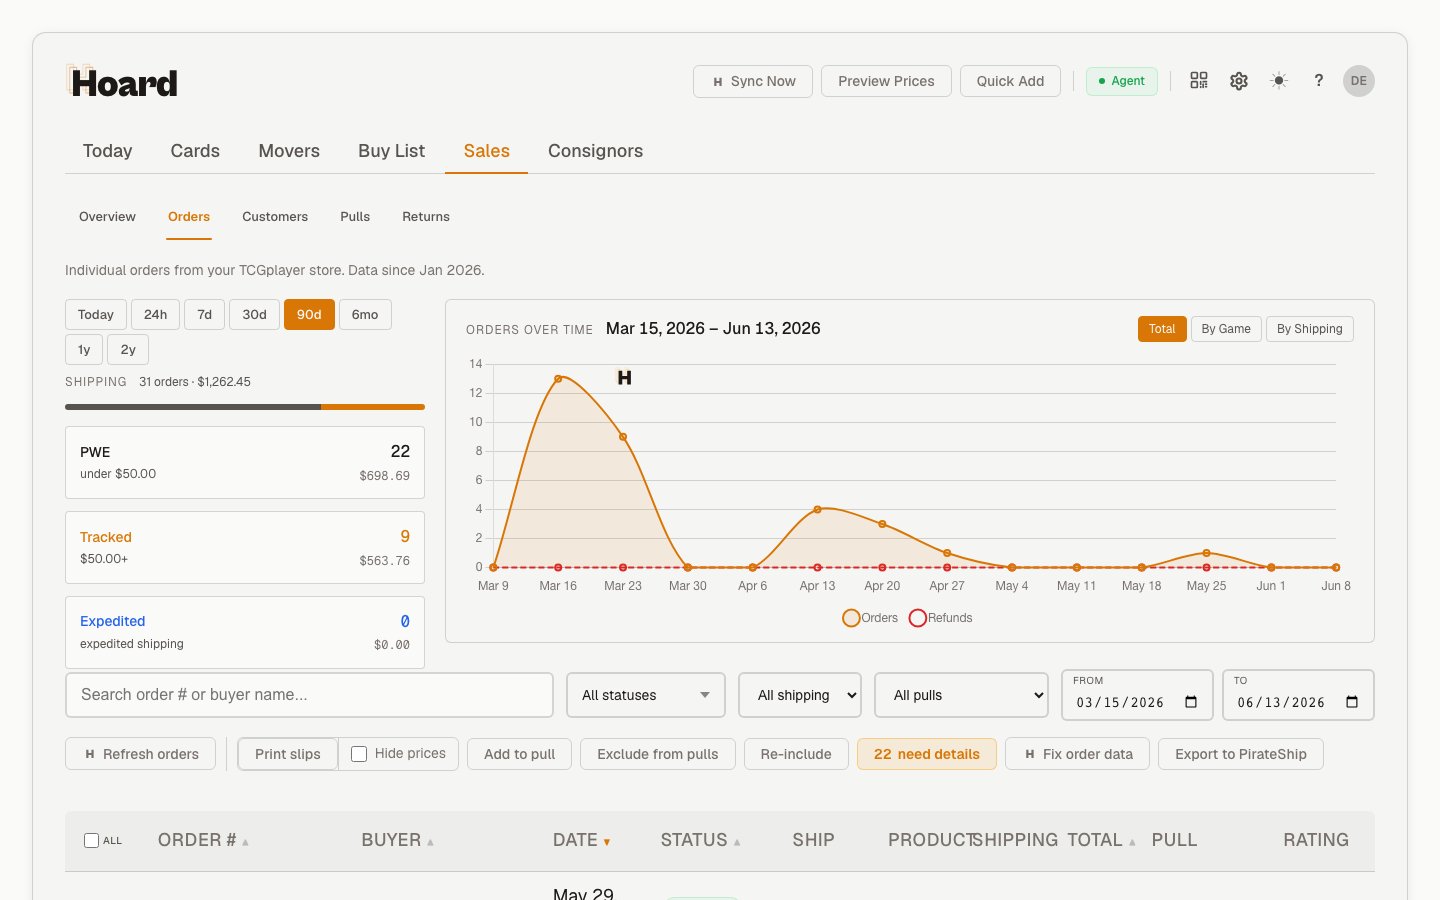 The same date-range pills appear on Orders, Customers, Pulls, and Returns, so the window control is in the same place on every subtab.
## Orders workspace
The Orders subtab is the manager view for TCGplayer orders. It includes:
* Search by order number or buyer
* Status, shipping, date, and Pull session filters
* A shipping mix widget with **Today**, **24h**, **7d**, **30d**, and **90d** shortcuts
* Pull links for orders that belong to a Visual Pull session
* An **Unassign** action when an order needs to be removed from a pull and made eligible for a future session
Shipping-period shortcuts are included in the URL, so you can bookmark a view like "today's tracked/PWE mix" and open it later with the same time filter.
## Customers workspace
The Customers subtab is your buyer intelligence dashboard. The stat row across the top shows:
| Tile | What it tells you |
| ---------------------- | ----------------------------------------------------------------------------------------------------------------------------------------------------------------------------------------------------------------------------- |
| Total Customers | Unique buyers in the period |
| Repeat Rate | Percent of buyers with more than one order |
| Total Revenue | Sum of order totals (refunded orders count as \$0) |
| Avg Feedback | Your average TCGplayer feedback rating for the period, with rating count and response rate in the label (e.g. `47 ratings (95.9%) → 4.91`). High score with a low response rate is still good — any feedback at all is a win. |
| Top 10 = N% of Revenue | What share of revenue comes from your top 10 buyers, with a Pareto bar |
Below that, the customer list shows tier, lifetime value, last order date, notes, and a slide-out with full order history per buyer. Use the **All / Repeat / VIP** filters to narrow the list.
Free plan shows the last 90 days. Upgrade to Pro for full history.
## Pulls workspace
The Pulls subtab shows the active pull session, a card-based progress bar, completed game queues, and a history table with per-pull stats. Use it to start the next fixed pull, open the QR cover sheet, or inspect how the last pull went.
## Returns workspace
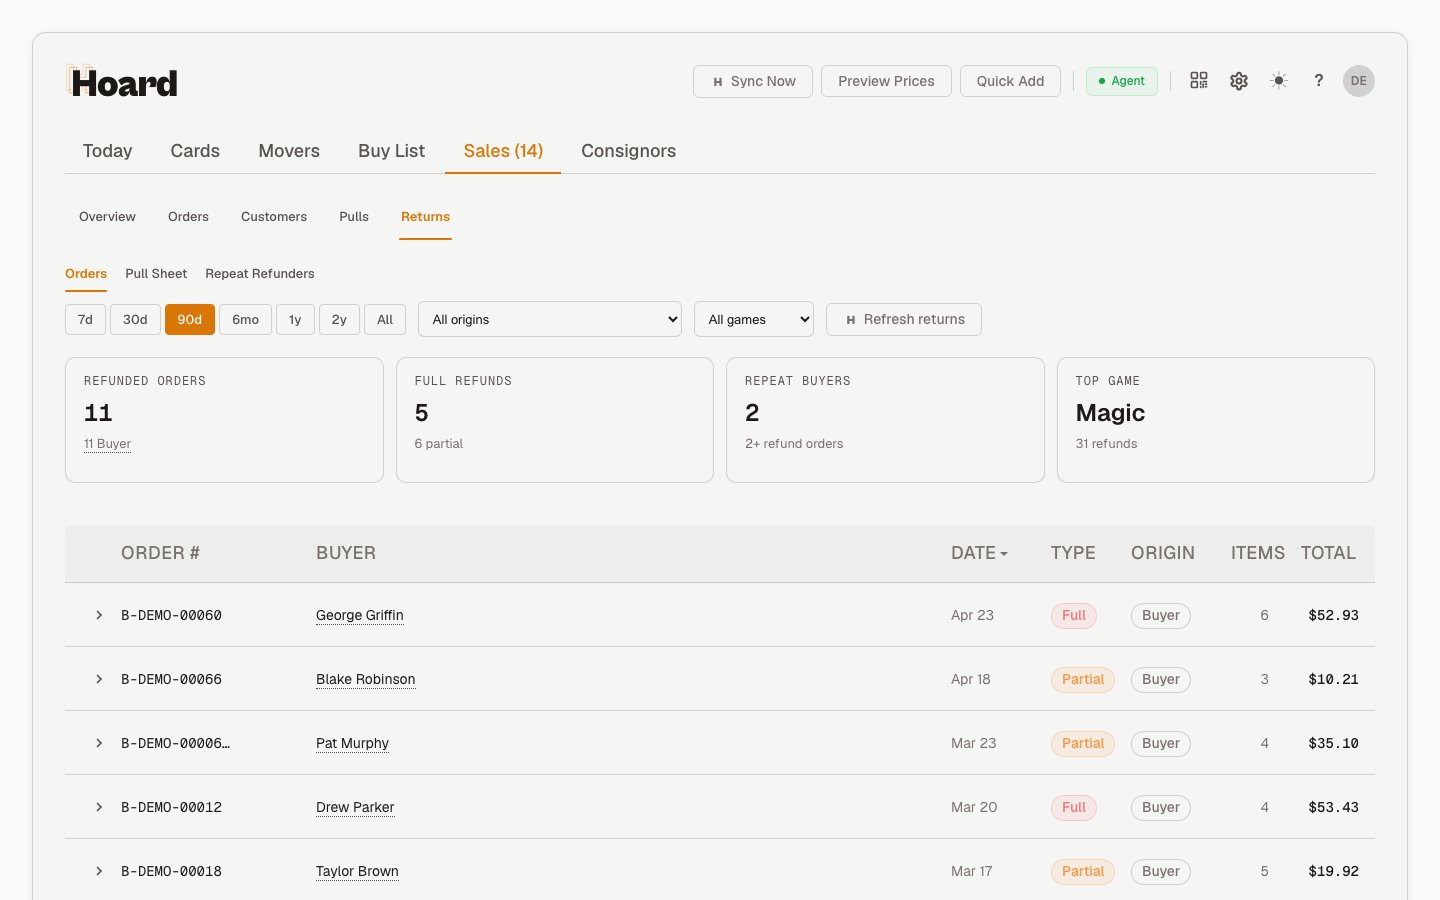
The Returns subtab tracks refunds: refunded-order count, full versus partial split, repeat refunders, and your top refunded game, with a filterable table of each refund order (type, origin, items, total) and a restock pull sheet. Filter by date range, origin (buyer, TCGplayer, seller), or game.
The same date-range pills appear on Orders, Customers, Pulls, and Returns, so the window control is in the same place on every subtab.
## Orders workspace
The Orders subtab is the manager view for TCGplayer orders. It includes:
* Search by order number or buyer
* Status, shipping, date, and Pull session filters
* A shipping mix widget with **Today**, **24h**, **7d**, **30d**, and **90d** shortcuts
* Pull links for orders that belong to a Visual Pull session
* An **Unassign** action when an order needs to be removed from a pull and made eligible for a future session
Shipping-period shortcuts are included in the URL, so you can bookmark a view like "today's tracked/PWE mix" and open it later with the same time filter.
## Customers workspace
The Customers subtab is your buyer intelligence dashboard. The stat row across the top shows:
| Tile | What it tells you |
| ---------------------- | ----------------------------------------------------------------------------------------------------------------------------------------------------------------------------------------------------------------------------- |
| Total Customers | Unique buyers in the period |
| Repeat Rate | Percent of buyers with more than one order |
| Total Revenue | Sum of order totals (refunded orders count as \$0) |
| Avg Feedback | Your average TCGplayer feedback rating for the period, with rating count and response rate in the label (e.g. `47 ratings (95.9%) → 4.91`). High score with a low response rate is still good — any feedback at all is a win. |
| Top 10 = N% of Revenue | What share of revenue comes from your top 10 buyers, with a Pareto bar |
Below that, the customer list shows tier, lifetime value, last order date, notes, and a slide-out with full order history per buyer. Use the **All / Repeat / VIP** filters to narrow the list.
Free plan shows the last 90 days. Upgrade to Pro for full history.
## Pulls workspace
The Pulls subtab shows the active pull session, a card-based progress bar, completed game queues, and a history table with per-pull stats. Use it to start the next fixed pull, open the QR cover sheet, or inspect how the last pull went.
## Returns workspace
The Returns subtab tracks refunds: refunded-order count, full versus partial split, repeat refunders, and your top refunded game, with a filterable table of each refund order (type, origin, items, total) and a restock pull sheet. Filter by date range, origin (buyer, TCGplayer, seller), or game.
 ## Metrics tracked
| Metric | What it means |
| --------------- | -------------------------------------------- |
| Gross Sales | Total revenue before fees and refunds |
| Net Sales | Revenue after fees and refunds |
| Total Fees | TCGplayer marketplace fees |
| Order Count | Number of orders in the period |
| Shipping Amount | Shipping charges collected |
| Refund Amount | Total refunded to buyers |
| Refunded Orders | Number of refunded orders |
| Adjustments | TCGplayer adjustments (credits, corrections) |
## How sales data is collected
Hoard downloads TCGplayer's Seller Sales Report CSV for each month:
1. **Current month** — refreshed every sync (month-to-date)
2. **Historical months** — backfilled 2 months per sync cycle until complete
After a few sync cycles, you'll have complete sales data going back several months.
## Sales chart
The chart shows a visual breakdown of sales over time, so you can spot trends in revenue, fees, refunds, and net income.
Sales report import is non-fatal. If it fails, inventory sync still completes. Historical data backfills automatically over subsequent syncs.
## Metrics tracked
| Metric | What it means |
| --------------- | -------------------------------------------- |
| Gross Sales | Total revenue before fees and refunds |
| Net Sales | Revenue after fees and refunds |
| Total Fees | TCGplayer marketplace fees |
| Order Count | Number of orders in the period |
| Shipping Amount | Shipping charges collected |
| Refund Amount | Total refunded to buyers |
| Refunded Orders | Number of refunded orders |
| Adjustments | TCGplayer adjustments (credits, corrections) |
## How sales data is collected
Hoard downloads TCGplayer's Seller Sales Report CSV for each month:
1. **Current month** — refreshed every sync (month-to-date)
2. **Historical months** — backfilled 2 months per sync cycle until complete
After a few sync cycles, you'll have complete sales data going back several months.
## Sales chart
The chart shows a visual breakdown of sales over time, so you can spot trends in revenue, fees, refunds, and net income.
Sales report import is non-fatal. If it fails, inventory sync still completes. Historical data backfills automatically over subsequent syncs.